IGNOU BECE 142 Solved Assignment 2022-23 , BECE 142 APPLIED ECONOMETRICS Solved Assignment 2022-23 Download Free : BECE 142 Solved Assignment 2022-2023 , IGNOU BECE 142 Assignment 2022-23, BECE 142 Assignment 2022-23 , BECE 142 Assignment , BECE 142 APPLIED ECONOMETRICS Solved Assignment 2022-23 Download Free IGNOU Assignments 2022-23- BACHELOR OF ARTS Assignment 2022-23 Gandhi National Open University had recently uploaded the assignments of the present session for BACHELOR OF ARTS Programme for the year 2022-23. Students are recommended to download their Assignments from this webpage itself. Study of Political Science is very important for every person because it is interrelated with the society and the molar values in today culture and society. IGNOU solved assignment 2022-23 ignou dece solved assignment 2022-23, ignou ma sociology assignment 2022-23 meg 10 solved assignment 2022-23 ts 6 solved assignment 2022-23 , meg solved assignment 2022-23 .
IGNOU BECE 142 Solved Assignment 2022-23
We provide handwritten PDF and Hardcopy to our IGNOU and other university students. There are several types of handwritten assignment we provide all Over India. BECE 142 APPLIED ECONOMETRICS Solved Assignment 2022-23 Download Free We are genuinely work in this field for so many time. You can get your assignment done – 8130208920
Important Note – IGNOU BECE 142 Solved Assignment 2022-2023 Download Free You may be aware that you need to submit your assignments before you can appear for the Term End Exams. Please remember to keep a copy of your completed assignment, just in case the one you submitted is lost in transit.
Submission Date :
- 31st March 2033 (if enrolled in the July 2033 Session)
- 30th Sept, 2033 (if enrolled in the January 2033 session).
Answer all the questions.
A. Long Answer Questions (word limit-500 words)
1) Explain, theoretically, the consequences of omitting relevant variables in econometric modelling.
In order to understand the consequences of the omitted variable bias, we first have to understand what is needed to obtain good estimates. When studying the linear regression models, you necessarily come across the Gauss-Markov theorem. This theorem states that if your regression model fulfills a set of assumptions (the assumptions of classical linear regression model), then you will obtain the best, linear, and unbiased estimates (BLUE ). One important assumption of this set of assumptions states that the error term of the regression model must be uncorrelated with the explanatory variables. However, as you will see in a minute, omitting a relevant variable introduces a correlation between the explanatory variables and the error term.
What happens when you omit an important variable? From the introductory post, you should know that one of the conditions for an omitted variable bias to exist is that the omitted variable is correlated with the independent variable and with at least one other explanatory variable. Now, when omitting a variable, it will show up in the residual, i.e. it will show up in the error term. Thus, the error term and independent variables are necessarily going to be correlated. This clearly violates the assumption that the error term and the independent variables must be uncorrelated. A violation of this assumption causes the OLS estimator to be biased and inconsistent. For a mathematical proof of this statement see this post.
Furthermore, when looking at the discussion using the Venn diagram, note that omitting a variable causes the unexplained variance of Y (the dependent variable) to increase as well as the variance of the estimated coefficient to decrease. This might lead to a situation in which you reject the null-hypothesis and believe that your coefficients are statistically significant at a given significance level although they are not.
How serious is the omitted variable bias..
The problem of the omitted variable bias is pretty serious. An omitted variable leads to biased and inconsistent coefficient estimate. And as we all know, biased and inconsistent estimates are not reliable. From our previous post, you might remember how omitting a variable can change the signs of the coefficients, depending on the correlation of the omitted variable with the independent and explanatory variables. Thus, coefficients also become unreliable. Hence, the regression model will fail completely. In a simple simulation exercise, I tried to visualize what happens if we neglect a relevant variable from a regression models. The exercise confirms that when neglecting a relevant variable from the model, OLS fails to estimate the coefficients correctly.
We‘ll study the consequences of failing to include important variables in a linear regression model. For illustration, we’ll base our discussion on a real world data set of automobile characteristics. Our goal will be to formulate a well-known result in statistical modeling called Omitted Variable Bias and to illustrate the calculation using the sample data set.
The automobiles data set
The following data contains specifications of 205 automobiles taken from the 1985 edition of Ward’s Automotive Yearbook. Each row contains a set of 26 specifications about a single vehicle.
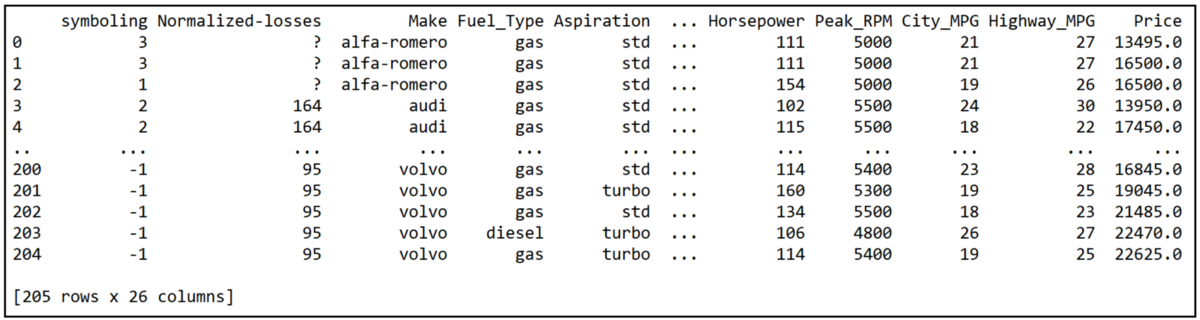
We’ll consider a subset of this data consisting of the following variables:
City_MPG
Car_Volume
Curb_Weight
Engine_Size
The Car_Volume variable is not present in the original data set. It is a new variable we have added as follows: Car_Volume = Length*Width*Height.

The above 4-variables version of the data set is available for download from here.
Regression goal
Our regression goal is to regress City_MPG on Engine_Size and Curb_Weight using a linear regression model. The model equation is:
City_MPG = β_1 + β_2*Car_Volume+ β_3*Curb_Weight + β_4*Engine_Size + ϵ
The error term ϵ of the regression model represents the effects of all the factors that the modeler has been unable to measure.
The matrix version of the above equation is written as follows:

Where,
- y is an [n x 1] size column vector containing the observed values of City_MPG. n being the number of data points.
- β is a [4 x 1] size column vector of regression model coefficients β_1, β_2, β_3, β_4 corresponding to the intercept, Car_Volume, Curb_Weight and Engine_Size.
- X is a [n x 4] size matrix containing the values of the regression variables. The first column of this matrix is a column of 1s and it acts as the placeholder for the intercept β_1.
- ϵ is an [n x 1] size column vector of the model’s regression errors.
Let’s illustrate how the regression model’s equation looks like using matrices:

The first column represented by the column vector x_1=[x_11,…x_n1]’ in the X matrix is a column of 1s. Assuming a sample size of n, the above matrix representation is equivalent to writing out the following system of n regression equations:


Here is the matrix representation of the above partitioning:

In general, we can express the above partition as follows:

We have substituted the partitioned out regression variable x_4 with the variable z which is an [n x 1] column vector. γ (gamma) is a [1 x 1] “matrix” that takes the place of regression coefficient β_4.
When one trains (a.k.a. ‘fits’) the above mentioned linear model on a data set of n samples, the fitted model can be expressed as follows:

Notice the cap or hat “^” symbol over β and γ indicating that they are the fitted values i.e. the estimates of the corresponding population level values of β and γ. Also in equation (2), the column vector of residual errors e takes the place of the column vector of regression errors ϵ. The ith residual error e_i is the difference between the ith observation y_i and the corresponding ith predicted value from the fitted model.
We have now prepared the ground for addressing the problem of what happens when you omit regression variables.
2) Discuss the effect of lags on ‘market equilibrium’ with suitable examples.
Definition of Market Equilibrium
Market equilibrium is a market state where the supply in the market is equal to the demand in the market. The equilibrium price is the price of a good or service when the supply of it is equal to the demand for it in the market. If a market is at equilibrium, the price will not change unless an external factor changes the supply or demand, which results in a disruption of the equilibrium.
If a market is not at equilibrium, market forces tend to move it to equilibrium. Let’s break this concept down.
If the market price is above the equilibrium value, there is an excess supply in the market (a surplus), which means there is more supply than demand. In this situation, sellers will tend to reduce the price of their good or service to clear their inventories. They probably will also slow down their production or stop ordering new inventory. The lower price entices more people to buy, which will reduce the supply further. This process will result in demand increasing and supply decreasing until the market price equals the equilibrium price.
If the market price is below the equilibrium value, then there is excess in demand (supply shortage). In this case, buyers will bid up the price of the good or service in order to obtain the good or service in short supply. As the price goes up, some buyers will quit trying because they don’t want to, or can’t, pay the higher price. Additionally, sellers, more than happy to see the demand, will start to supply more of it. Eventually, the upward pressure on price and supply will stabilize at market equilibrium.
Examples of Market Equilibrium
Flat Screen TVs
Imagine that you make flat screen televisions. Your flagship model is a 72-inch plasma that currently wholesales to your retailers at $2,500. Unfortunately, your warehouse has recently been filling a bit too quickly with 72-inch plasmas. This is probably because each of your three largest competitors has finally gotten around to introducing their own 72-inch televisions, which means that there are a bunch more 72-inch televisions on the market. You decide to lower your wholesale price to $2,250 and see what happens. You also decide to cut production down by 25% for the next month to clear out existing inventory.
When you reviewed the numbers at the end of the month, the price reduction did work, but not quite well enough. So you decide to reduce the wholesale price once again to $2,100 and keep production at the same level. When you reviewed the numbers at the end of the month, you see that you barely have any inventory and the purchase orders from your retailers have started to go up a bit. In the following months, orders have kept up with production and inventory is where it is suppose to be. It appears that the price for your television has reached market equilibrium.
Equilibrium
Disequilibrium
Changes in equilibrium
For example, suppose there is a sudden invasion of aggressive unicorns. There will be more people who want to buy unicorn repellent at all possible prices, causing demand to increase. At the original price, there will be a shortage of unicorn repellant, signaling sellers to increase the price until the quantity supplied and quantity demanded are once again equal.
Changes in Supply
How did you do? If you adjusted the graph correctly, you should see the equilibrium price decreases to dollar sign, 4 and equilibrium quantity increases to 4 stickers.
B. Medium Answer Questions (word limit-250 words)
3) Outline how R2 and adjusted-R2 serve as indicators of ‘goodness of fit’ of a regression model.
4) Indicate the form of a Logit Model. Specify why the OLS method of estimation cannot be applied here.
5) Show that ‘exact identification’ is a sufficient condition for the unique determination of a system of equations.
IGNOU Handwritten Hardcopy , WhatsApp – 8130208920
IGNOU BECE 142 Solved Assignment 2022-2023 We provide handwritten PDF and Hardcopy to our IGNOU and other university students. There are several types of handwritten assignment we provide all Over India. BECE 142 APPLIED ECONOMETRICS Solved Assignment 2022-23 Download Free We are genuinely work in this field for so many time. You can get your assignment done – 8130208920
GET IGNOU Handwritten Hardcopy , WhatsApp – 8130208920
C. Short Answer Questions (word limit 100 words)
6) Differentiate between:
(a) Quantitative Research and Qualitative Research.
(b) In-sample forecast and out-of-sample forecast.
(c) Autoregressive Model and Autoregressive Distributed Lag Model.
7) Write short notes on the following.
(a) Instrumental Variables (IV) Method.
(b) Pooled Cross Section Data.
(c) Linear Static Panel Data Model.
Get IGNOU BECE 142 Solved Assignment 2022-23 Download Free Now here from this website.
IGNOU BECE 142 Solved Assignment 2022-2023 get here all ignou solved assignment 2022-23 , ignou guess paper , ignou help books and ignou exam related material. We help students to get their assignment done with our handwritten services, BECE 142 APPLIED ECONOMETRICS Solved Assignment 2022-23 Download Free you can access our all material and services through WhatsApp also , 8130208920
GET SOLVED PDF – Click Here
IGNOU Instructions for the BECE 142 APPLIED ECONOMETRICS Solved Assignment 2022-23
IGNOU BECE 142 Solved Assignment 2022-2023 Download Free Before attempting the assignment, please read the following instructions carefully.
- Read the detailed instructions about the assignment given in the Handbook and Programme Guide.
- Write your enrolment number, name, full address and date on the top right corner of the first page of your response sheet(s).
- Write the course title, assignment number and the name of the study centre you are attached to in the centre of the first page of your response sheet(s).
- Use only foolscap size paperfor your response and tag all the pages carefully
- Write the relevant question number with each answer.
- You should write in your own handwriting.
GUIDELINES FOR IGNOU Assignments 2022-23
IGNOU BECE 142 Solved Assignment 2022-23 You will find it useful to keep the following points in mind:
- Planning: Read the questions carefully. IGNOU BECE 142 Assignment 2022-23 Download Free Download PDF Go through the units on which they are based. Make some points regarding each question and then rearrange these in a logical order. And please write the answers in your own words. Do not reproduce passages from the units.
- Organisation: Be a little more selective and analytic before drawing up a rough outline of your answer. In an essay-type question, give adequate attention to your introduction and conclusion. IGNOU BECE 142 Solved Assignment 2022-2023 Download Free Download PDF The introduction must offer your brief interpretation of the question and how you propose to develop it. The conclusion must summarise your response to the question. In the course of your answer, you may like to make references to other texts or critics as this will add some depth to your analysis.
- Presentation: IGNOU BECE 142 Solved Assignment 2022-2023 Download Free Download PDF Once you are satisfied with your answers, you can write down the final version for submission, writing each answer neatly and underlining the points you wish to emphasize.
IGNOU Assignment Front Page
The top of the first page of your response sheet should look like this: Get IGNOU Assignment Front page through. And Attach on front page of your assignment. Students need to compulsory attach the front page in at the beginning of their handwritten assignment.
ENROLMENT NO: …………………………………………………….
NAME: ……………………………………………………………………
ADDRESS: ………………………………………………………………
COURSE TITLE: ………………………………………………………
ASSIGNMENT NO: …………………………………………………
STUDY CENTRE: …………………………………………….……..
DATE: ……………………………………………………………………
BECE 142 Handwritten Assignment 2022-23
IGNOU BECE 142 Solved Assignment 2022-23 – We provide handwritten PDF and Hardcopy to our IGNOU and other university students. BECE 142 APPLIED ECONOMETRICS Solved Assignment 2022-23 Download Free Download PDF There are several types of handwritten assignment we provide all Over India. BECE 142 APPLIED ECONOMETRICS Solved Assignment 2022-23 Download Free Download PDF We are genuinely work in this field for so many time. You can get your assignment done –8130208920
BUY PDF & Handwritten
- Solved PDF Cost – @50 rs per Paper / Subject
- Handwritten Hardcopy – @350 rs per paper/ subject
WhatsApp – 813020892